
My “quick hack” internal tool for reviewing automation pipelines became a sales demo, and turned into an organizational analytics product with complex data visualization interfaces.
Further details of this case study are under NDA. Contact me for more information.
What the work is
From the very beginning Complexio has a single mission: ingest only communication data (emails) and automatically recognize what the automation opportunities in a business are. Not just doing the automation, but automatically discovering which automations to build.
This technical capability turned into a product based on an internal tool I developed during a week in the summer of 2025. I got frustrated that we were reviewing multi-step LLM output as markdown files in a code editor, including during sales demos. I knew there was a way to do this more humanely.
After the co-CEOs began taking my internal tool into customer rooms, it became the foundation of the product Complexio productized as Enterprise Automator. I handed over the productionizing to a developer team, and developed additional features that turned Enterprise Automator into an organizational analytics tool.
My approach
Prototype to reveal what the product could be, not to execute on what someone already specified. The visualization wasn’t filed as a ticket. I built it because the demo problem was visible from where I sat. Once it existed, the org pulled it into the sales materials immediately.
Follow real data, not speculation. My prototyping discipline is to design only what our pipeline can actually deliver. The AI field is moving super quickly, and the goal is not to design for next year’s capabilities, but for what is already possible tomorrow.
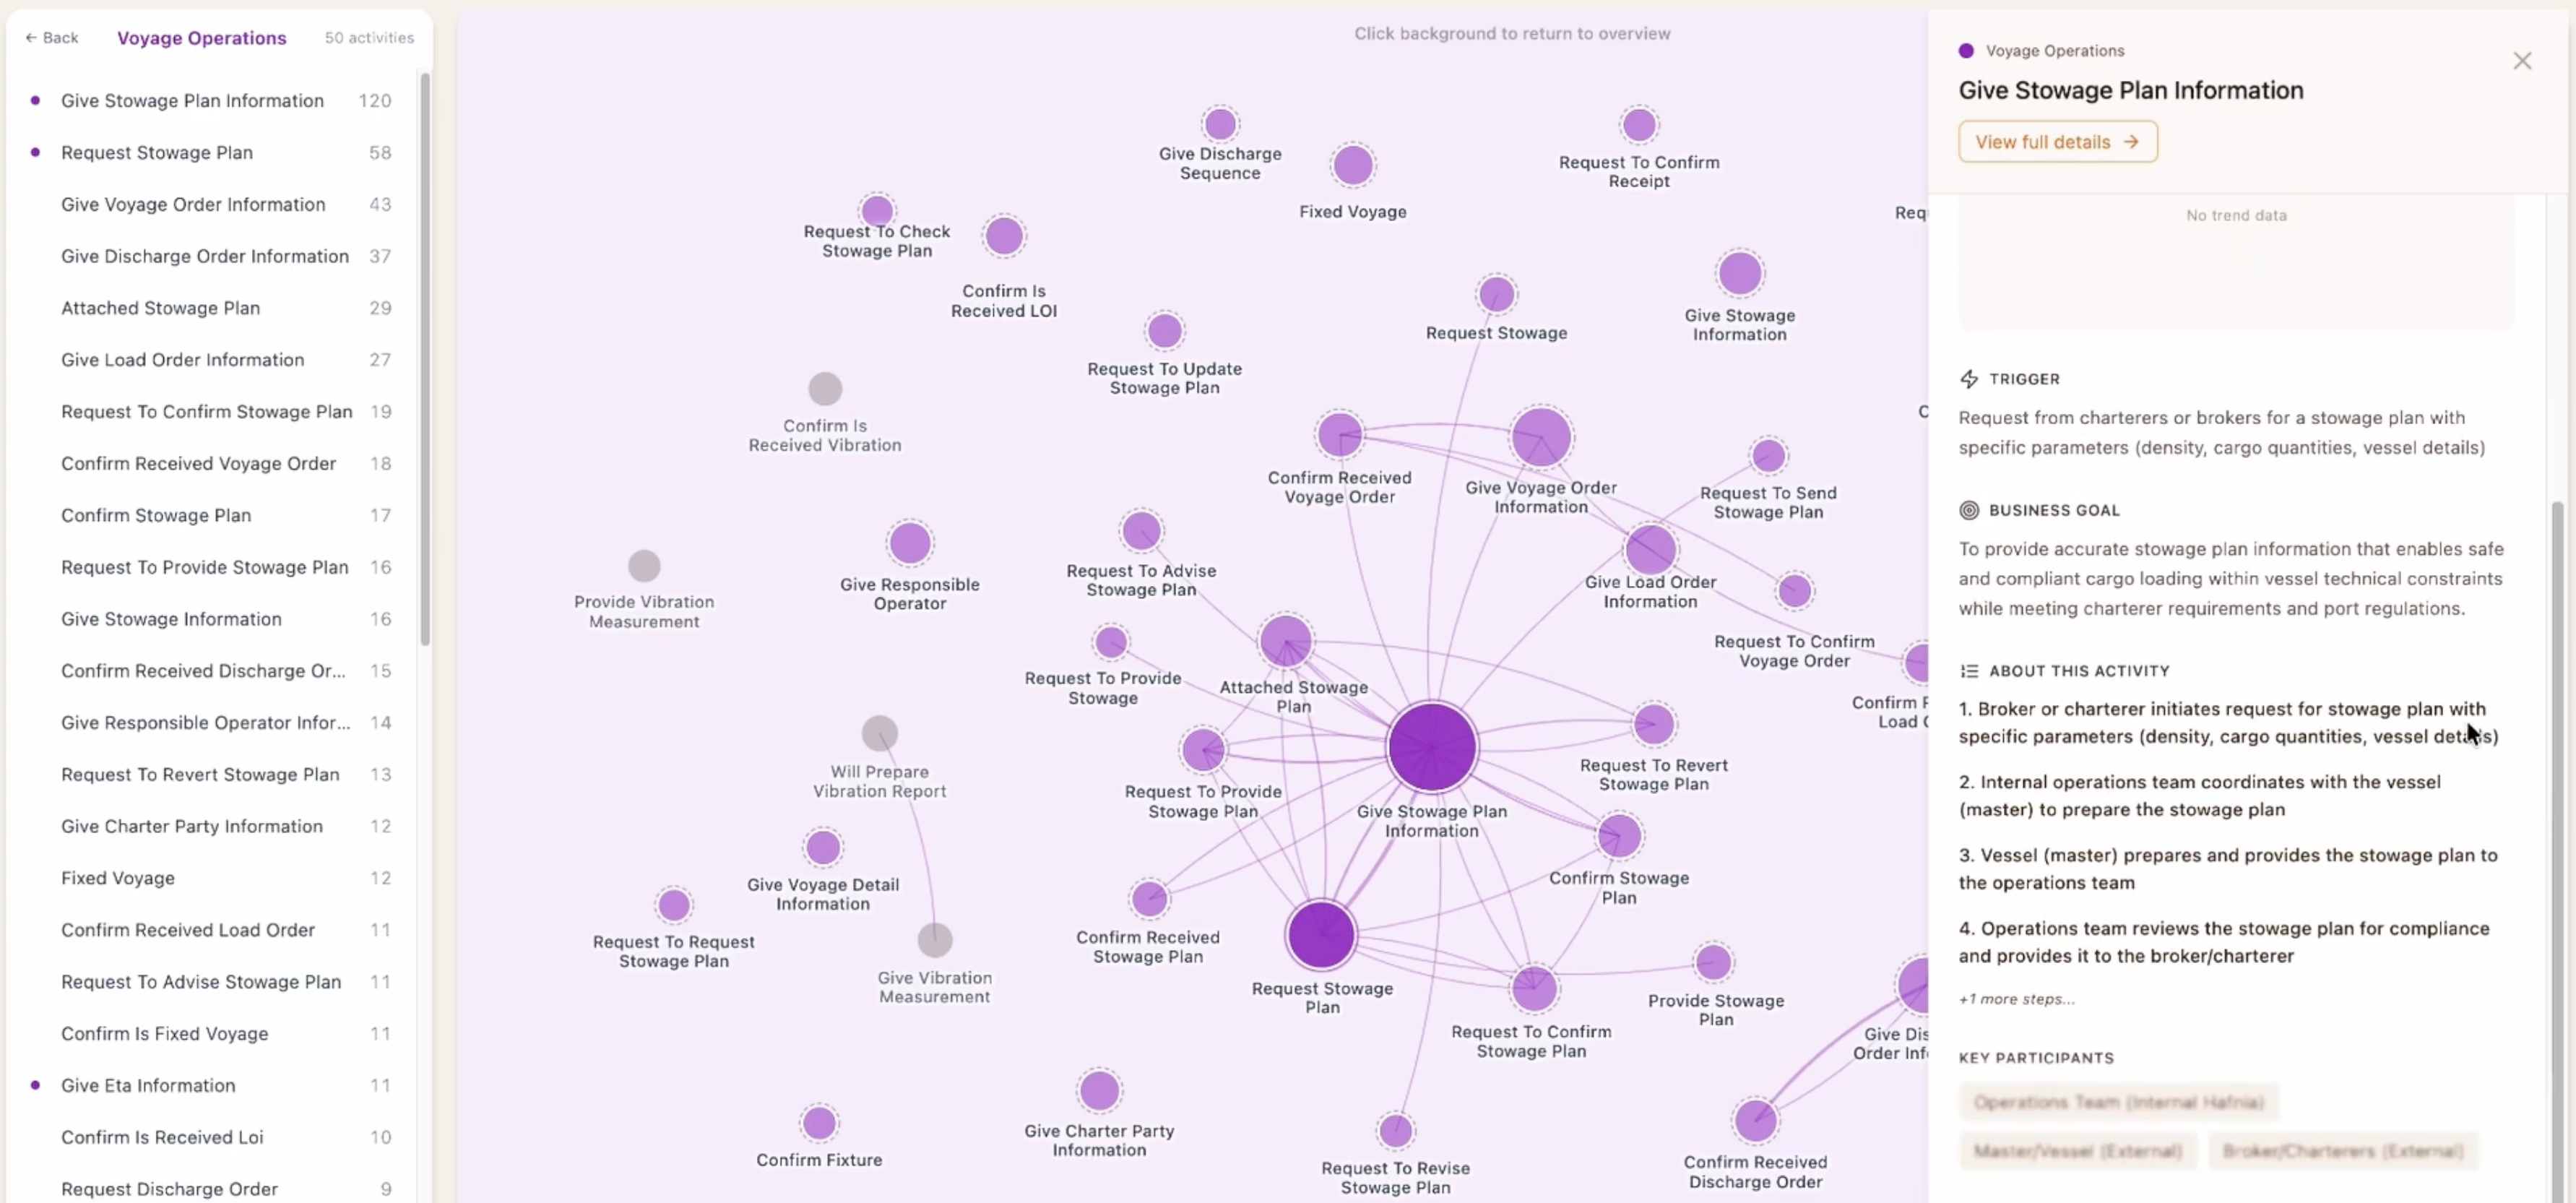
Don’t stop at the looks — dig under the hood. While building the visualization I spent significant time reviewing the LLM pipeline behind it, found redundant steps, and also ended up contributing to the pipeline directly. One example: after recognizing the walls of textual descriptions of business processes, I added a swim-lane diagram-generation step to condense the output for the users significantly.
My contribution
- Built the v0 prototype, set the core interface principles with it, supported customer demos, then handed production-grade engineering off to a developer team and stayed on as designer-of-record.
- Contributed to the LLM pipeline itself, including a process-diagram-generation step that became part of the demo output.
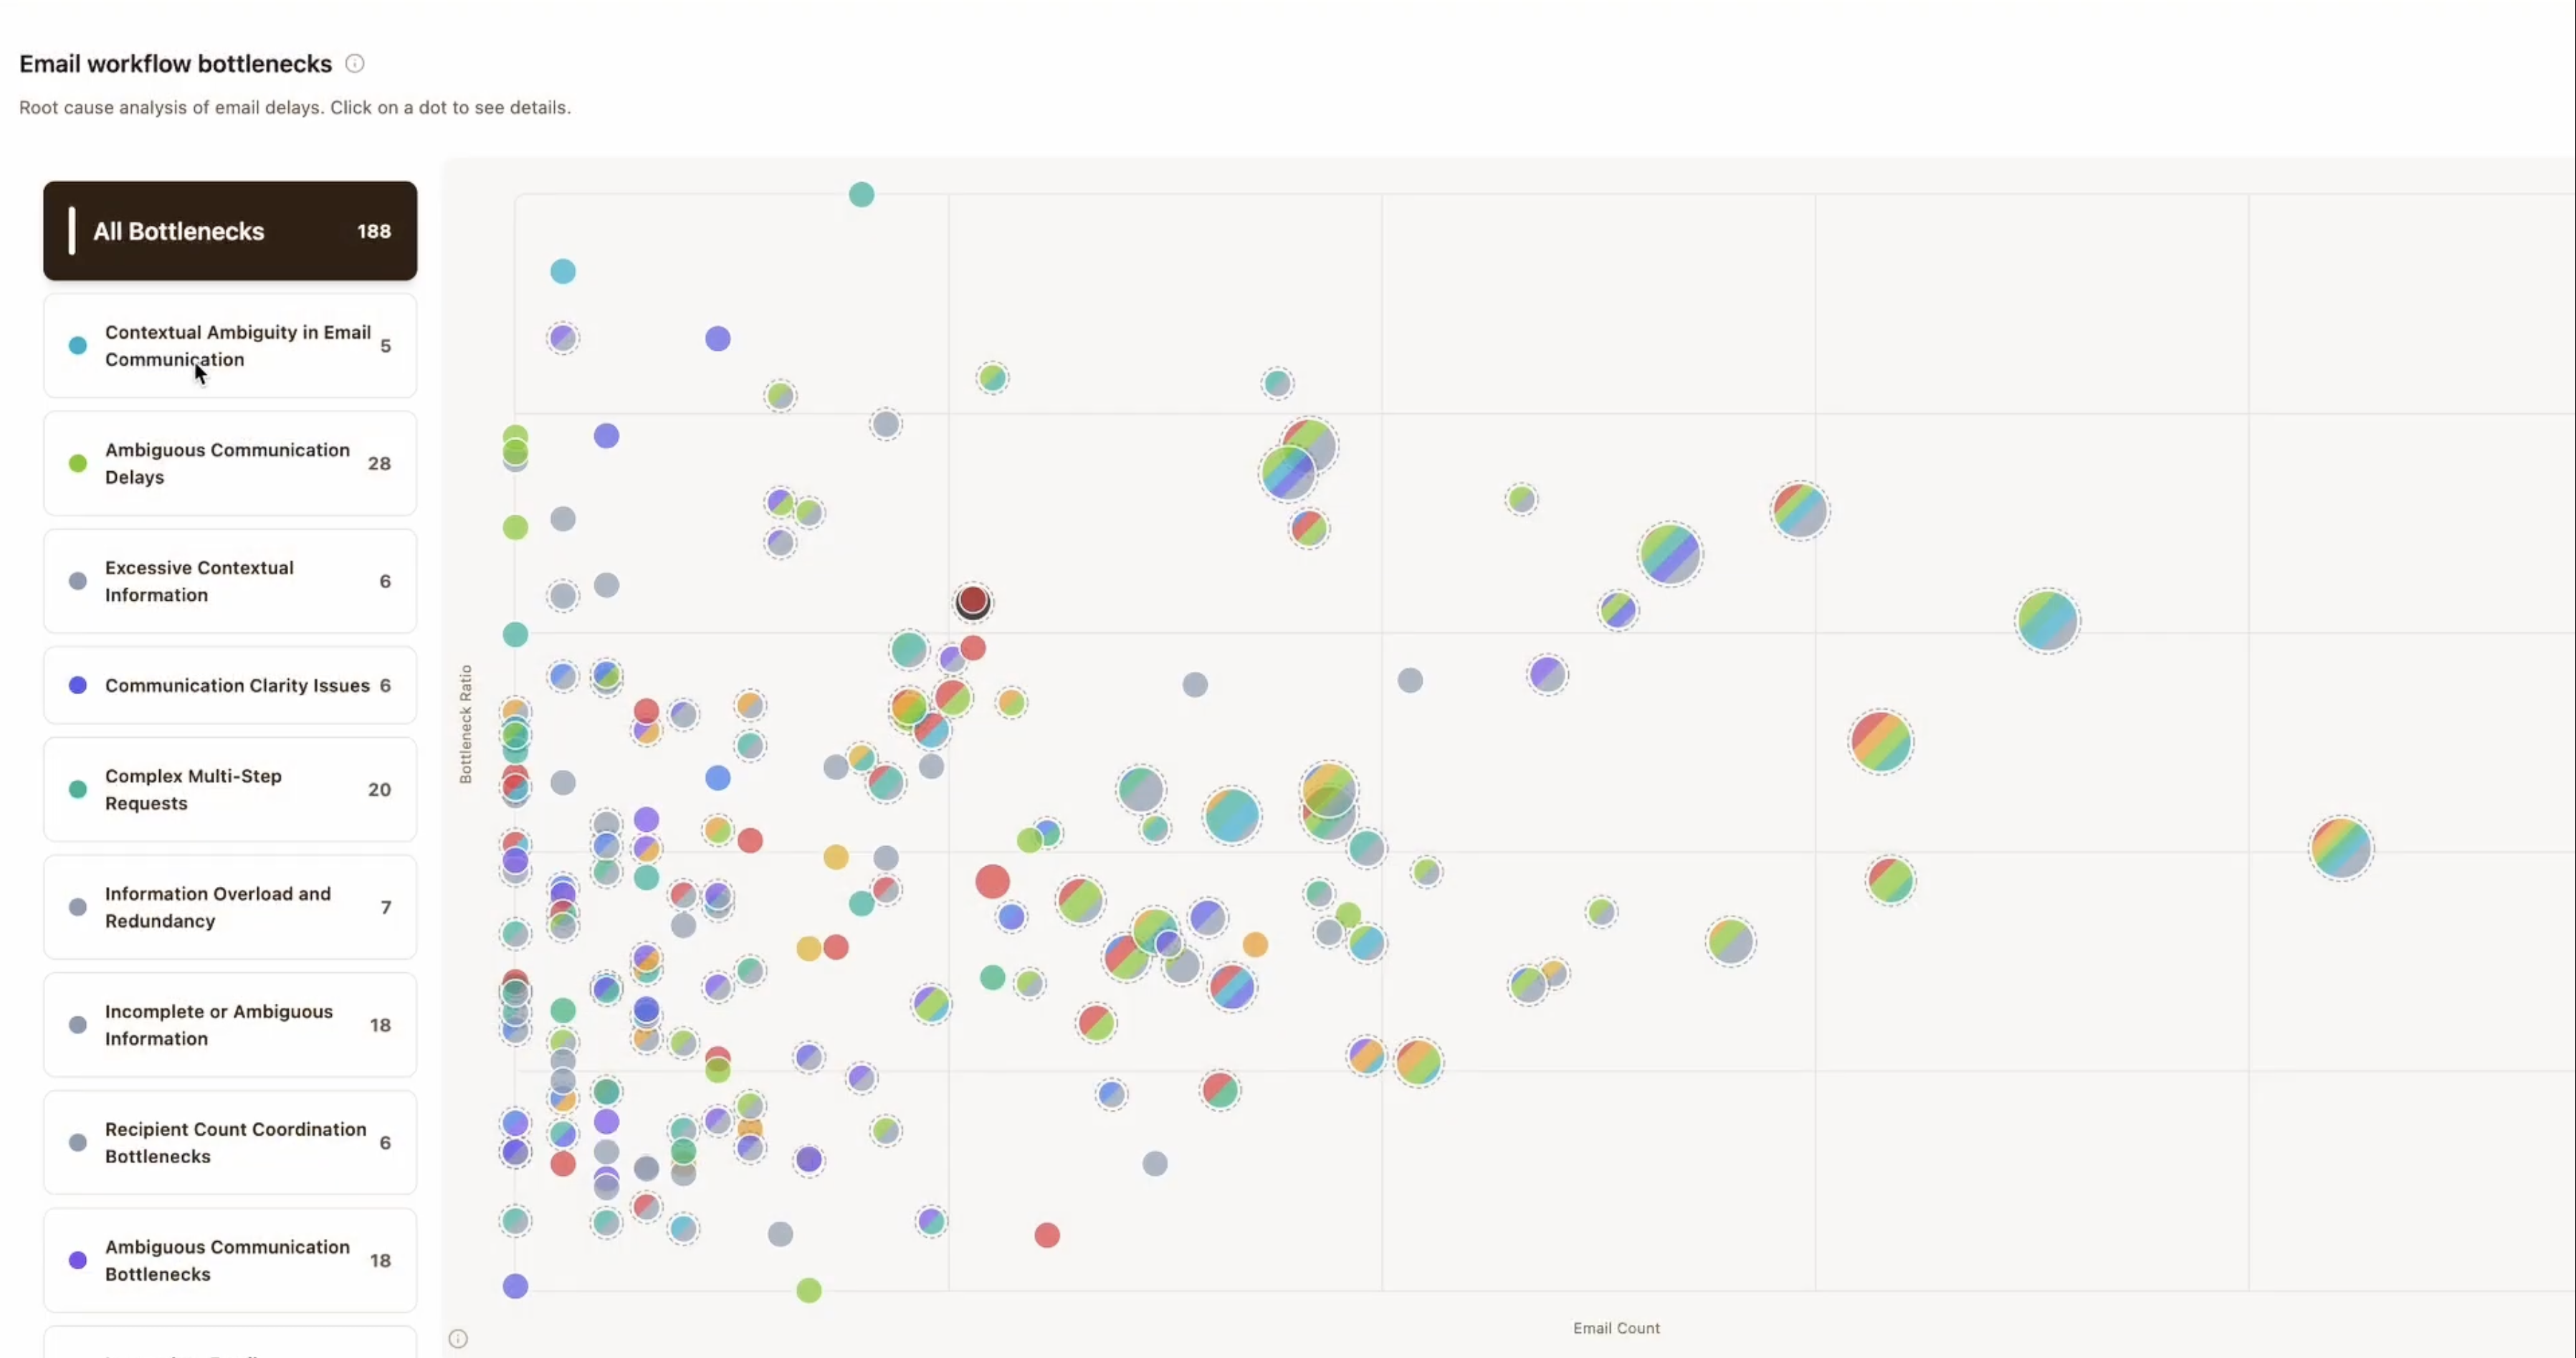
- Partnered with a data scientist on the bottleneck methodology. They owned the work-time math and clustering; I designed the concept of what to do with it and how to visualize it: a scatter plot with bottleneck-ratio on Y, email-volume on log-scale X, and a root-cause filter labelled by an LLM reading the outlier rows. The insight: use the LLM to qualitatively read what is in the outliers — the p95 cases — not by mean. What went wrong when things took days instead of hours?
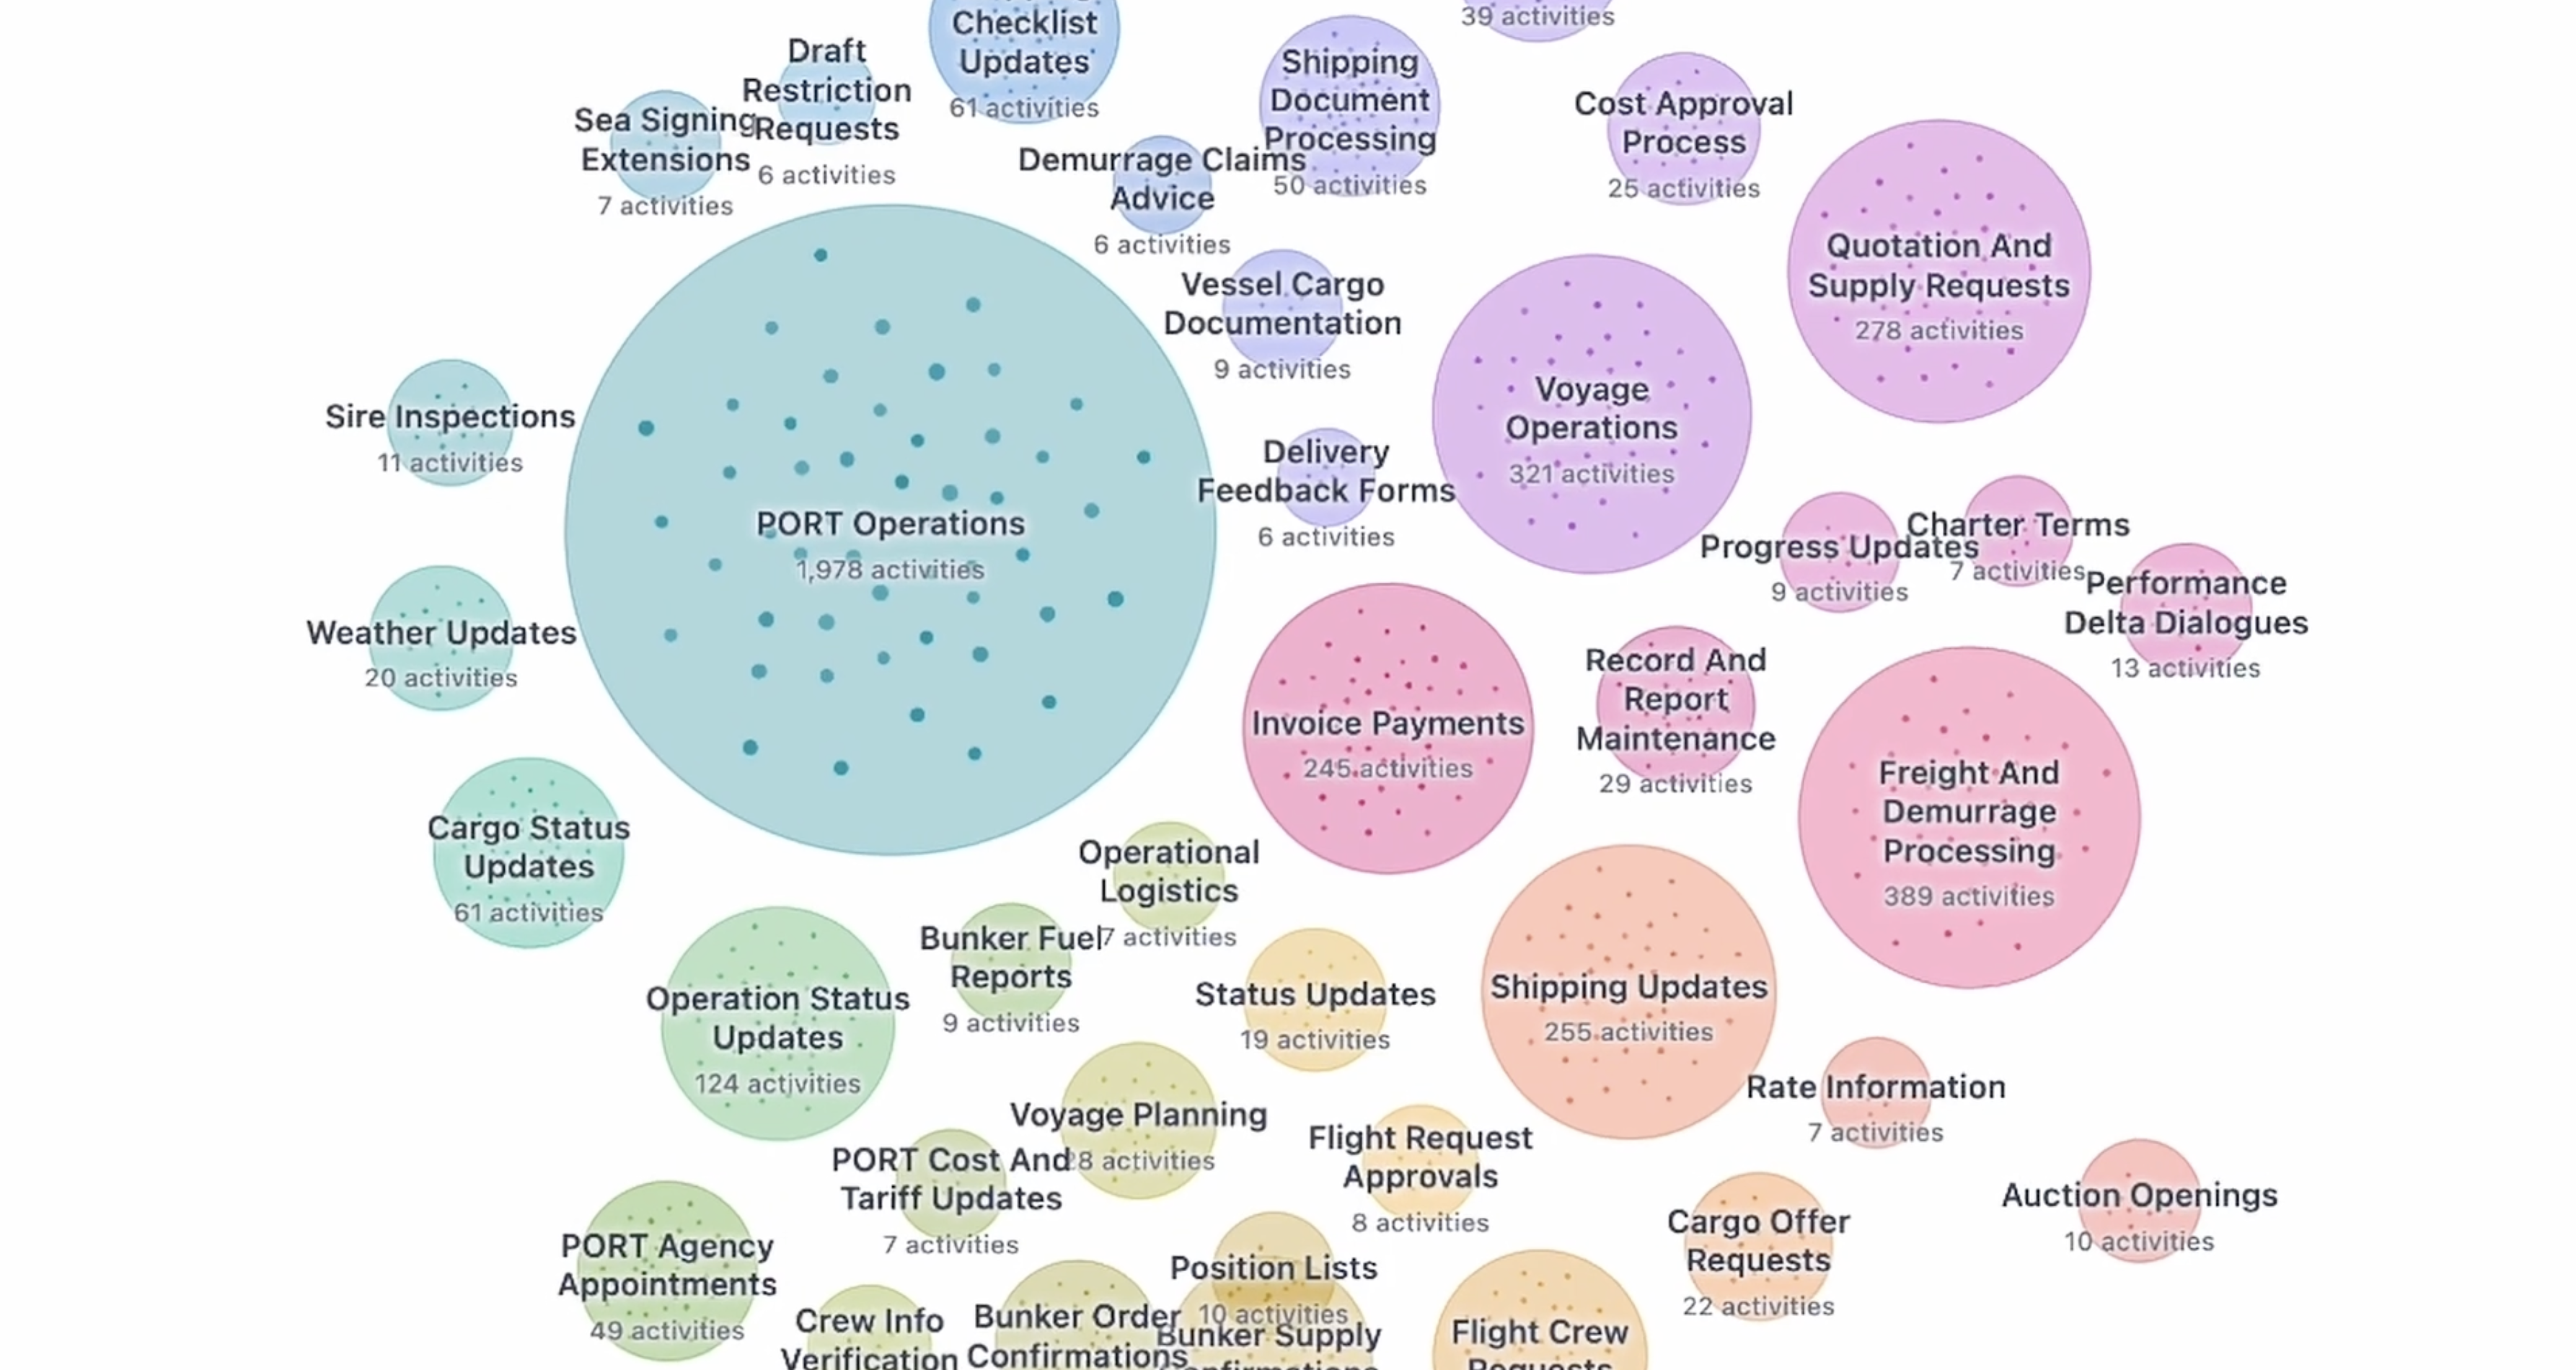
- Built a complex multi-level visualization combining force-directed clustering, networked graphs, naming algorithms to enable users to untangle their business processes and find automation opportunities in them.
My behavior in the team
- The go-to person for turning technical achievement into something a human can use. I made the technical achievement of the LLM pipeline legible to non-engineers, then iterated until it could be interrogated.
- Cross-product coverage. I worked across our product portfolio and brought coherent solutions to them.
- Shipping code like a developer. Production frontend, backend endpoints, LLM pipelines, data wrangling: I have dropped in wherever the prototype reveals the next constraint.